This website uses cookies so that we can provide you with the best user experience possible. Cookie information is stored in your browser and performs functions such as recognising you when you return to our website and helping our team to understand which sections of the website you find most interesting and useful.

ITEMLIST
Products Infomation

- Products by Category
- Automotive&EV
- aptpod VISUAL M2M
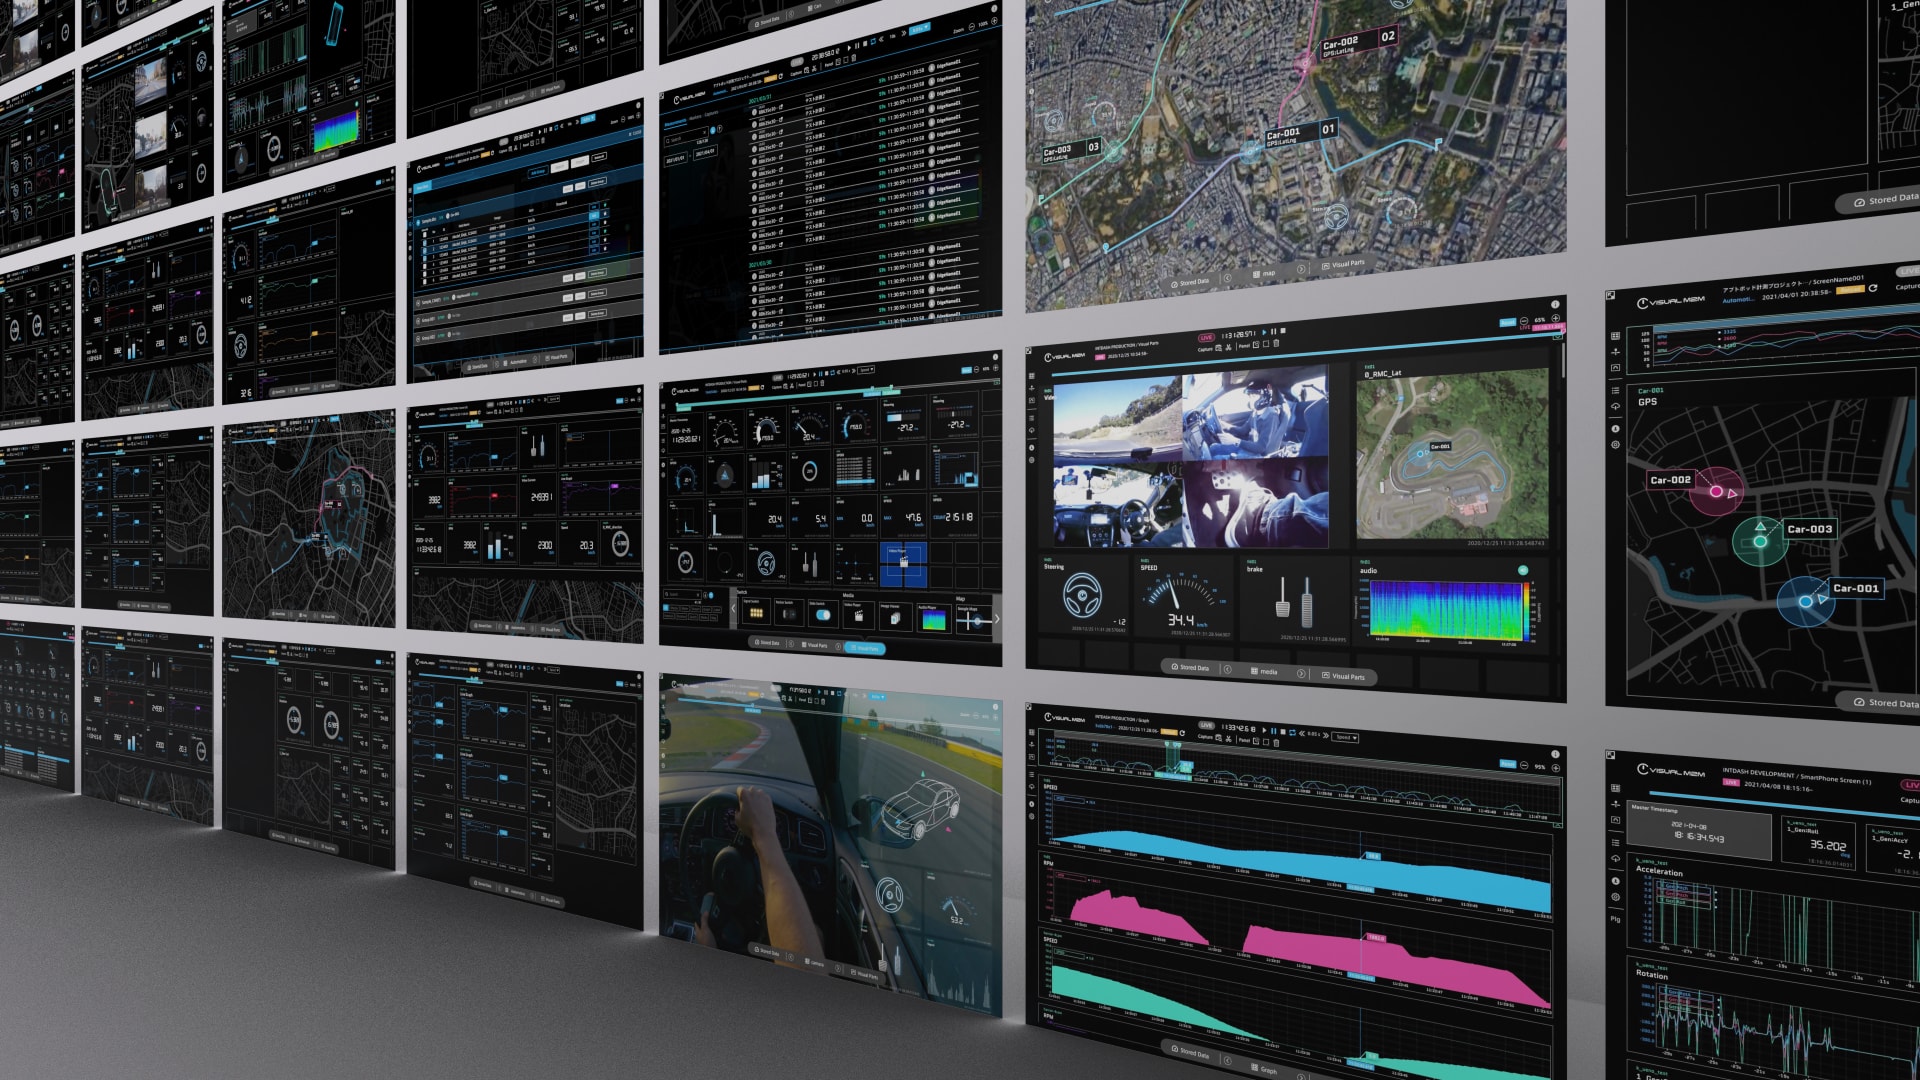
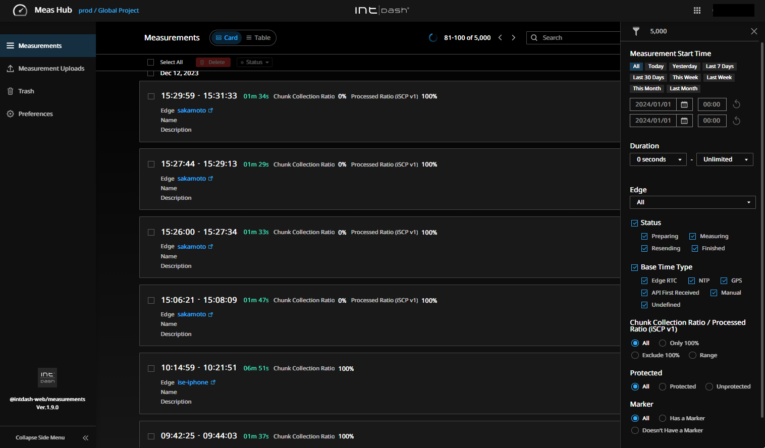
A multifunctional user interface on the browser displays real-time data, stored data graphs, timeseries data visualization, and CSV download.
A user-friendly interface that runs on a web browser offers a range of features such as real-time data streaming, graphing of stored data, and versatile visualization of time-series data. Additionally, it allows users to download data in CSV format. The interface also enables users to create dashboards and visualize data from multiple perspectives using an intuitive drag-and-drop operation.
VISUAL M2M Data Visualizer
Maker:
aptpod,Inc.
Features
A Powerful Tool for Time-Series Data Visualization and Analysis
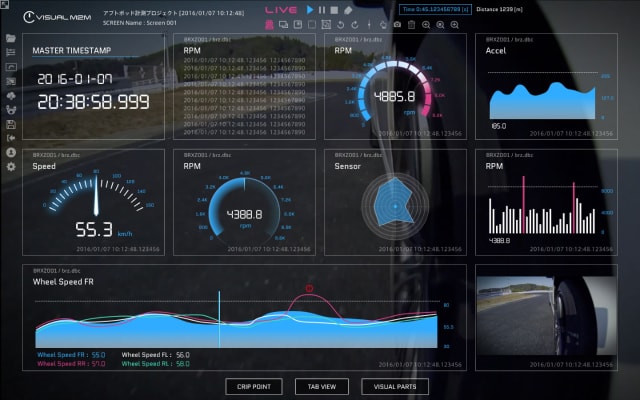
Visual M2M Data Visualizer is a tool that provides a range of visualizations for time-series data. It includes simple text displays, beautiful meters and graphs, maps with GPS tracking, video, and audio visualization. It also allows for simple data analysis by displaying average values, maximum values, and graphs.
Other features include:
– Graph display along the timeline
– Real-time statistics display
– Data tagging and searching
– GPS data mapping
– Playback and visualization of video and audio
– Data display with 2D or 3D models
In short, Visual M2M Data Visualizer is a powerful tool that helps businesses gain insights from their time-series data by providing a range of visualizations and data analysis features.
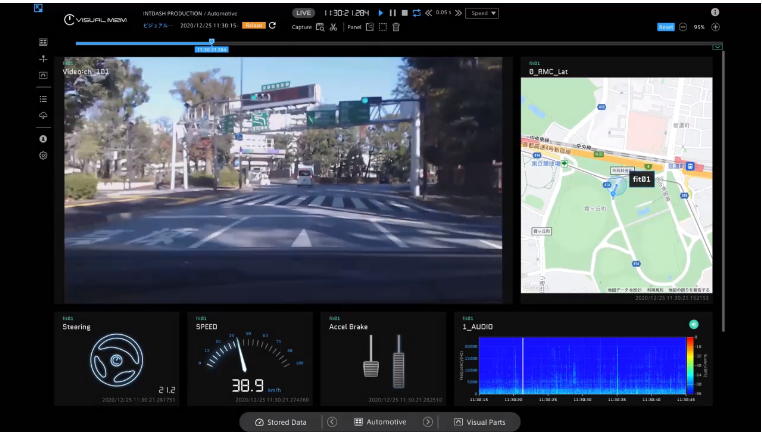
Playback and visualization of video and audio
Visual M2M Data Visualizer is a tool that enables users replay time-series data, including control signals and sensor signals, video, image, and audio data, and display synchronized data simultaneously, enabling integrated visualization of fusion data.
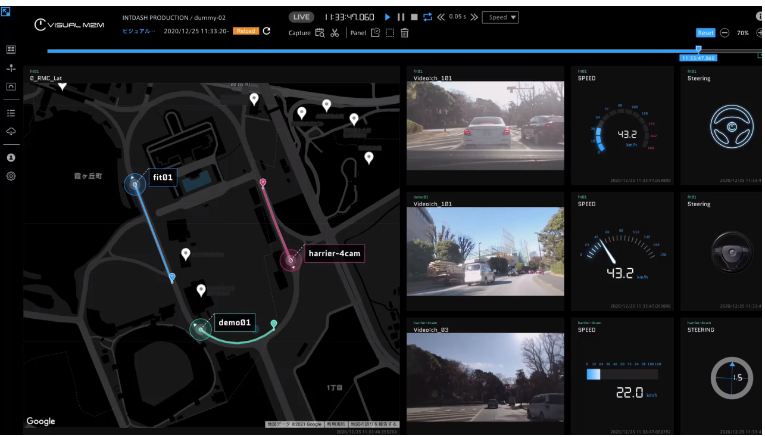
Flexible comparison displays of multiple devices and multiple data types
Visual M2M Data Visualizer enables comparison and analysis of data from multiple devices by binding data onto the same dashboard. Data Visualizer can also be used for real-time fleet monitoring by displaying multiple devices simultaneously.
Automatically managed time-series data and easy data access
Visual M2M Data Visualizer allows you to easily access stored data accumulated in the time-series database. The stored data is automatically sorted by the acquisition time, and you can load an entire measurement data set or load partial data by specifying the start and end times. You can also quickly access desired data by adding a tag to any time point.
Binary data conversion
Visual M2M Data Visualizer allows you to convert binary format messages, such as CAN data fields, into physical values, such as numerical values and flag values, by loading the data definition file prepared in advance. You can also download data converted into physical values to your PC as a CSV file.


Discover the intdash Automotive Pro CAN/CAN-FD DAQ Bundle: your comprehensive package for remote automotive measurements, featuring an in-vehicle edge computer, CAN data interface device, cloud system, and a sophisticated data visualization and management application.
![]()
To view the pdf files, the Adobe Reader from Adobe Systems is required.