This website uses cookies so that we can provide you with the best user experience possible. Cookie information is stored in your browser and performs functions such as recognising you when you return to our website and helping our team to understand which sections of the website you find most interesting and useful.
ITEMLIST
Products Infomation

- Products by Category
- Automotive&EV
- Motor Coil Testers
- ECG-Kokusai Impulse Winding Tester DWX Series
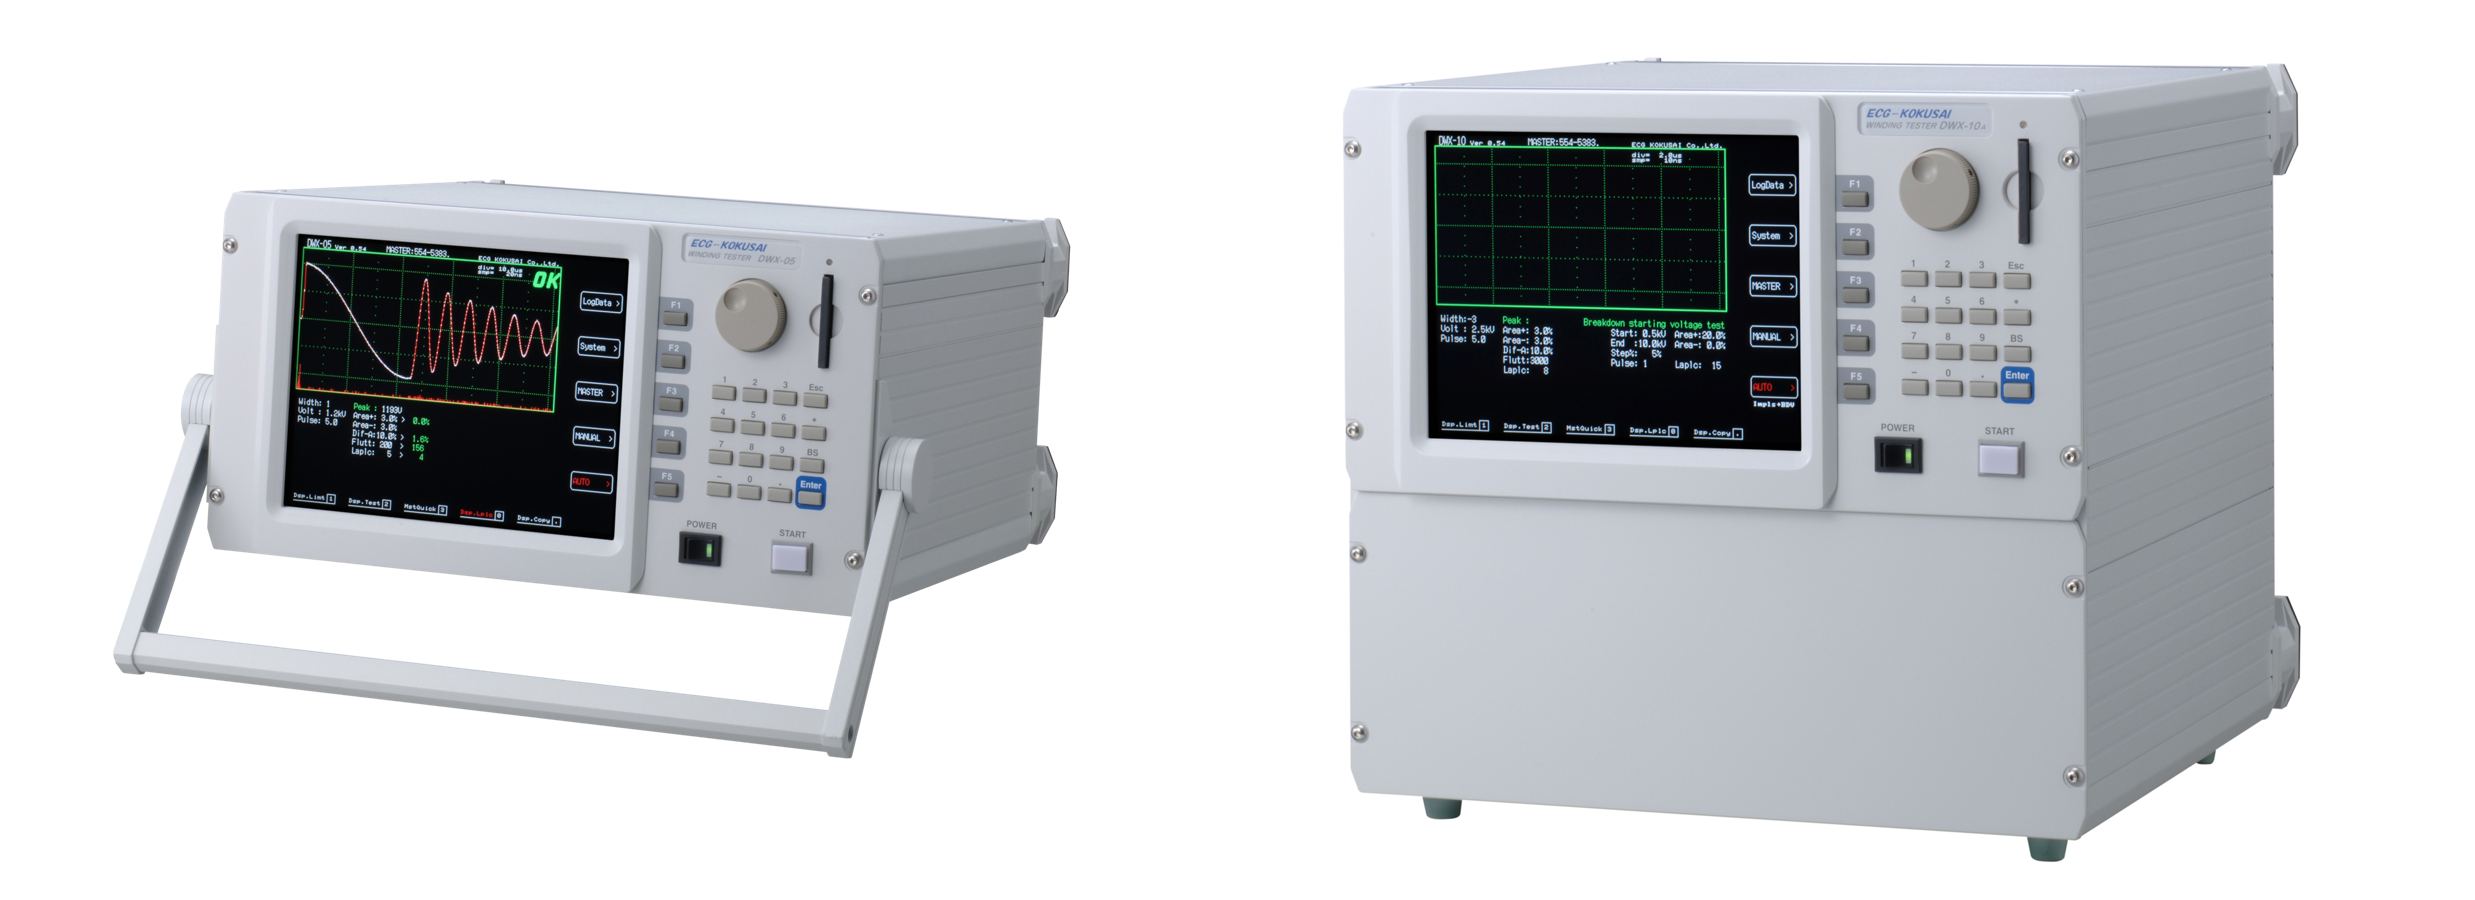
Impulse Winding Tester DWX Series: DWX-01A (1000V), 05A (5000V), and 10 (10000V)
[Contact Us]
The DWX Series Impulse Winding Testers is a solutions for coil testing, offering high-speed sampling, partial discharge detection, and precise waveform analysis
With the advanced requirement of miniaturization and high-frequency technology of coil products, the DWX tester is designed to test other coils and low-inductance coils used in high-end electronic components. Through the use of an impulse power source with a high-speed switch, a highly efficient input circuit, and a high-speed A/D sampling circuit, the DWX tester can offer a new solution to the low inductance coil tests.
Features
• This innovative tester offers a new solution for low inductance coil test.
With the advanced requirement of miniaturization and high-frequency technology of coil production, the DWX tester is designed to test other coils and low-inductance coils used in high-end electronic components. Through the use of an impulse power source with a high-speed switch, a highly efficient input circuit, and a high-speed A/D sampling circuit, the DWX tester can offer a new solution to the low inductance coil tests.
• Its advanced technology allows a complete waveform and partial discharge observation by the resistive voltage divider.
The high-performance voltage divider allows the DWX input circuit of the impulse waveform to generate a complete wave pattern without any distortion. At the same time, it also helps improve the partial discharge sensitivity and detection capability
(The DWX’s detection sensitivity is improved compared with that of our DW & DWS series, except for the DW-9505F).
• Its high sampling rate of 100 MHz delivers highly sensitive and precise tests.
Its high-speed A/D sampling helps to verify the extremely short impulse response of the low inductance coil. At the same time, the 8kByte sampling, with highly refined data analysis, can precisely capture the subtle difference in the wave patterns.
• The partial discharge amount calculated by the Laplacian method is displayed clearly in a separate sub-window.
The employed Laplacian method calculates the partial discharge (PD) generated by high voltage impulse. This PD, abstracted from the voltage wave, visually displays a bar graph in a separate sub-window, offering an easy and comfortable viewing.
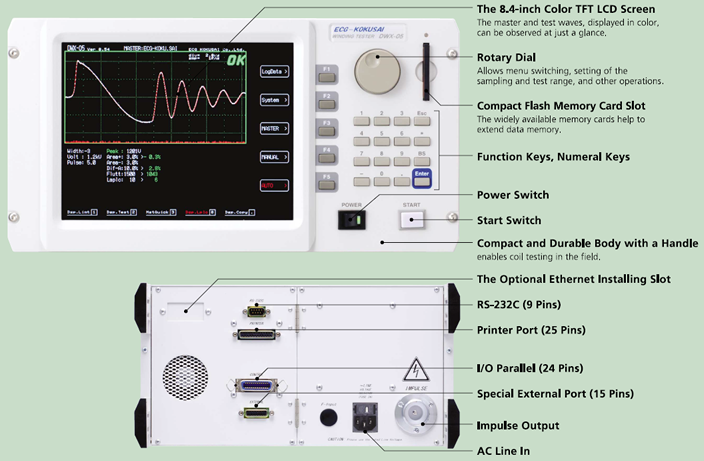
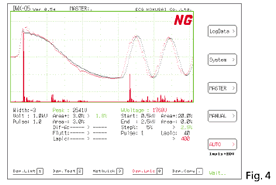
• The 8.4-inch color TFT LCD screen displays the waveform and is easy to view.3
• A combination of our proven Area, Dif-Area, and Flutter comparison methods can be selected to perform the layer short test.
All types of coils can be evaluated by choosing a combination of various test methods: Area Size Comparison, Differential Area Size Comparison, Flutter Value (Corona Discharge) Detection, and Laplacian Value and Laplacian Value (Corona Discharge) Detection. (* The Flutter Value Detection and the Laplacian Value Detection can only be selected alternatively.)
• The equipped compact flash memory device offers an unlimited memory of the master data.
HOW DOES THE IMPULSE WINDING TESTER WORK?
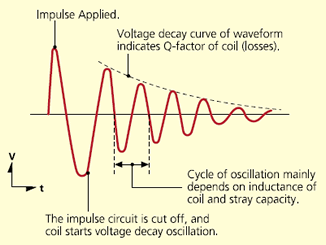 The impulse coil-winding tests the electrical characteristics of coil winding without damaging the sample. The prerequisite conditions for the quality of a coil can be detected at just a glance. The detection is carried out when the same electric impulse by capacitor discharge is applied to the master and the test coils. The voltage decay waveform is generated in response to the impulse, related to the Q-factor and inductance (impedance) of the coil. In this sense, the tester can detect turn & layer short, the differences in the number of turns, and the material of the core. If high impulse voltage is applied, the poor insulation will appear as a corona of layer discharge.
1. Area Comparison for Quality Assessment
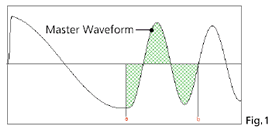
In a specified interval, the areas of the master and sample are compared to determine quality. As illustrated in Figure 1, the area of the interval from a to b is calculated, and the difference in area size is used for assessment. The judgment criterion is set as a percentage, and if the comparison results falls within this range, the product is deemed acceptable.
The area size is almost proportional to the energy loss within the coil, so the assessment is based on the extent of this loss. For instance, if the sample coil has a partial short circuit, the increased loss due to the shorted section will be reflected in the results.
2. Waveform Difference Area Comparison (DIF-AREA)
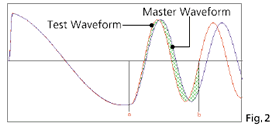 In a specified interval, the area of differing parts between the master and sample waveforms is calculated. As illustrated in Figure 2, the area in the interval from a to b is computed, and the size of this area is compared to the master area (corresponding to Figure 1) for assessment. The judgment criterion is set as a percentage, and if the comparison results fall within this range, the product is deemed acceptable.
The size of the waveform difference area represents the total of the L value and the loss magnitude. This assessment method is particularly effective when changes in the L value are a concern.
3. Corona Quantity Comparison (FLUTTERVALUE)
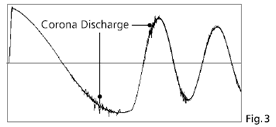
The Corona Quantity Comparison (FLUTTERVALUE) method focuses on detecting the amount of high-frequency components, such as corona discharge, while largely ignoring waveform differences. As illustrated in Figure 3, this method involves performing computational filtering on the waveform within a specified interval to detect corona components.
The size of these components is then used for assessment. The judgment criterion is set as an integer value, and if the detected value falls within this range, the product is deemed acceptable.
4. Corona Quantity Comparison (LAPLACIANVALUE)
 The Corona Quantity Comparison (LAPLACIANVALUE) method employs a digital filtering technique used in image processing to detect the strength of edges in a subject. Unlike the FLUTTERVALUE method, LAPLACIANVALUE focuses on quantifying numerical discontinuities (i.e., noise) hidden within the waveform data.
This approach allows for precise and clear assessment of discharge components, providing accurate detection and evaluation of corona discharge and similar high-frequency elements.
Specification
| DWX-01A | DWX-05A | DWX-10 | |
|---|---|---|---|
| Applied Voltage, Step, and Energy * At 1 kOhm Resistive Load |
50V~1000V (10V Step) Max 5 milli-Joules |
500V~5000V (100V Step) Max 0.12 Joules |
1000V~10000V (200V Step) Max 0.5 Joules |
| Inductance Test Range | More than 10μH | More than 50μH | |
| Sampling Speed | 8bit/10nano-sec.(100MHz) | ||
| Sampling Memory | 8192-Byte | ||
| Sampling Range | 10 Ranges: -4、-3、-2、-1、0、1、2、3、4、5 (Width 0 to 5 is the Compatible Range with the DW Series) |
||
| Input Test Circuit (Impedance) | Resistive Voltage Divider(5MOhm) | ||
| Screen Display Resolution Waveform Display Range | 640 x 480 Dots (VGA), 8.4″ TFT Color LCD, 4 Color Display 512 x 256 Dots |
||
| Detection Mode | Master Waveform Comparison Detection by Area Size Comparison, Differential Area Comparison and Corona Discharge |
||
| Master Waveform Memory | Internal Memory: 196 Types (14 Types per Page, 14 Pages) 700-Types by Compact Flash Memory (14 Types/50 Pages) |
||
| External Interface | Parallel I/O (Start, Reset, OK, NG, Busy, Master Numbers, etc.) RS-232C (Test Control, Test Data, etc.) Printer Port (Screen Hard Copy) Ethernet Adapter (Option) |
||
| Accessories | A Tester Cable (1.65m), A Power Cable (With 3P Adaptor) A Parallel I/O Connector An Instruction Manual and Inspection Record |
||
| Environmental Conditions | 0℃-40℃, AC Voltage Upon Your Request:100V/115v/220v/240V±5% | ||
| Dimension (Excluding the Handle)/ Weight | 345(W)×185(H)×370(D)
Approx10Kg |
345(W)×325(H)×370(D) | |
![]()
To view the pdf files, the Adobe Reader from Adobe Systems is required.