
This website uses cookies so that we can provide you with the best user experience possible. Cookie information is stored in your browser and performs functions such as recognising you when you return to our website and helping our team to understand which sections of the website you find most interesting and useful.


ITEMLIST
Products Infomation

- Products by Category
- NOISEKEN Electromagnetic Field Visualization System EPS-02 series
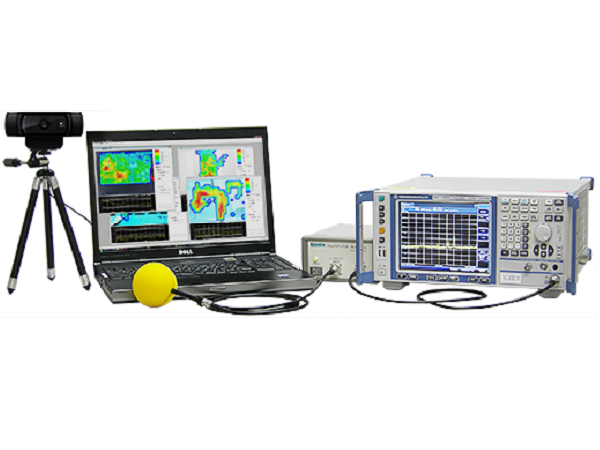
Three-Dimensional Indication (Time, Frequency, Amplitude) Simplifies EMC/EMI Debugging
The EPS-02 series are easy to use visualization tools for electromagnetic emission debugging. The system recognizes the position of the hand-held probe/sensor by using a color recognition technique and stores the measured intensities
at the relevant positions thus creating an intensity distribution map overlaid on the actual image of the scanned object. The system helps you to locate electromagnetic interference sources and to incorporate optimized solutions.
Electromagnetic Field Visualization System
Model:
EPS-02 series
Maker:
NOISE LABORATORY CO.,LTD.
Features
- Simple, easy-to-use and convenient visualization of electromagnetic fields
- Flexible color recognition setting depending on the color of sensor head enables a reliable sensor image tracking
- Intensity distribution map overlaid on the camera picture
- Flexibly covers any size of the target object by using a variety of probes/sensors
- Compensation available by using the built-in factor editor for user owned equipment as system components
- User configurable system
- Reads X, Y, Z-axis value and their composite (R) value and identifies the direction of the magnetic field (EPS-02H)
- Portable and suitable system for on-site measurements
VIDEO
Specifications
| Model Number | EPS-02Ev2 | EPS-02EMFv2 | EPS-02Hv2 |
| Frequency range | 100kHz to 3GHz in case of ETS-Lindgren probes set *varies depending on the probe used |
10Hz to 400kHz | 10Hz to 400kHz 10Hz to 2kHz 2kHz to 400kHz |
| Frequency setting | Available | Available | Unavailable |
| Measurement mode | Electric / magnetic | Magnetic field (flux density) | Magnetic field (flux density)/Exposure le |
| Measurement unit | dBuV,dBm | dBuV,dBm | T, G, A/m, % |
| Direction | – | X, Y, Z | X, Y, Z, composition |
| Sensor/probe | φ60/30/10mm loop coil (magnetic field), φ36mm ball (electric field), φ6mm tip (electric field) |
phi100 mm loop coil phi 30 mm loop coil |
phi 100 mm loop coil phi 330p coil |
| Probe cable length | 2 m coaxial, N male to BNC male | 5 m, dedicated | 5 m, dedicated |
| Image/Cell size | picture:640×480dot / Cell size:10~120dot | ||
| Trace mode | Single/Free run/Peak hold | Peak hold | |
| File handling | Save/readout/print/export/comment input | ||
| Compatible operating system | Windows vista / 7 / 8 / 8.1 | ||
| System configuration | Near field probe PN7415, Coaxial cable 02-00150A Probe head cover 03-00079A RF pre-amplifier 00-00013A Spectrum analyzer (customer supply) Controller PC (customer supply) |
Magnetic field meter (FT3470-91/92: by Hioki Electric) Oscilloscope (R&S RTO1004/1024-NSL by Rohde & Schwartz Japan) PC (customer supply) |
Magnetic field meter (FT3470-91/92: by Hioki Electric) PC (customer supply) |
| Included accessories common to the three products |
Camera, 2m USB cable for camera, tripod, software, USB protect key, instructions manual | ||
| Included accessories | LAN cable (cross) NI-GPIB-USB-HS GPIB controller |
LAN cable (straight) EPS-02H software |
USB cable |
![]()
To view the pdf files, the Adobe Reader from Adobe Systems is required.